
Scenario Analysis & Updated Forecasts, 2024–2030
Updated for 2025 and Q1 2026 Hyperscaler Earnings
Executive Summary
Datacenters sit at the marginal edge of global economic growth, as a new and strongly growing source of global metal demand. And this accelerating demand is challenging an underinvested supply side, driving price incentives higher to bring the market back into equilibrium. It’s against this backdrop that RCF has been intently curious to better understand the datacenter edge case — in other words, how will datacenter capital expenditure influence an otherwise stable system of metal supply satisfying a growing global economy?
Every forecast of AI-driven metals demand ultimately balances on a single focal point: how many terawatt-hours (TWh) of power will the world’s datacenters consume, and how does this marginal demand change year on year? RCF has chosen to analyze this growth on a foreseeable forecast period: out to 2030. The global TWh datacenter demand forecast is pivotal, but it also obscures more than it reveals. Not every metal inside a datacenter responds to electricity demand the same way. Some scale with the silicon — the chips, boards, and power electronics that expand in lockstep with installed compute capacity. Others scale with the concrete — the buildings, grid connections, and structural steel that expand in lockstep with new capacity under construction. Treat these as a single undifferentiated ‘AI metals’ story and the resulting forecast will be wrong in both directions at once.
This report updates our early-2026 datacenter metals demand framework, with confirmed 2025 datacenter power consumption data, Q1 2026 hyperscaler earnings, and revised agency forecasts. Its central contribution is not a new number but a discipline: separating datacenter metals demand into two structurally distinct tracks — Track A, which scales with power and compute, and Track B, which scales with premises and buildings — and following each to its own 2030 endpoint, its own leading indicators, and its own supply chain risk.
The distinction is not academic. It changes which bottlenecks matter, which metals are genuinely scarce versus merely large in volume, and which supply chain disruptions should move an investor’s forecast and which should not. Copper is the one metal that sits inside both tracks at once, which is precisely why it is the most acute and the most misunderstood risk in the entire system.
AT A GLANCE
- 2025 actual global datacenter electricity: 485 TWh, up 17% year-on-year; AI-dedicated capacity grew 50% over the same period (IEA, April 2026)
- Big-4 hyperscaler capex reached approximately $410 billion in FY2025 and is guided to approximately $725 billion in 2026, up 77% year-on-year
- Track A (power/compute) metals — copper interconnect, lithium, tin, tantalum, silver, rare earths, gallium, gold, palladium — scale directly with installed compute and are most exposed to the TWh trajectory
- Track B (premises/buildings) metals — steel, base metals (aluminum, zinc), and the majority of new copper demand — scale with construction, wiring, transformers and the grid-connection pipeline
- Copper is the only metal that sits in both tracks, making it the most acute cross-track supply risk in the system
- More than 25% of 2025-scheduled datacenter projects were delayed; 30–50% of the 2026 pipeline is at risk — a timing risk to near-term demand, not a reduction in the 2030 structural picture
Section I. The Two-Track Insight: Why One Number Isn’t Enough
Datacenter metals demand is conventionally forecast off a single variable: projected electricity consumption, expressed in terawatt-hours. This is a reasonable starting point, but it is an incomplete one. It implicitly assumes that every metal consumed by the buildout of AI infrastructure responds to the same underlying driver, at the same rate, with the same lead time. It does not.
Datacenter metals demand in fact divides into two structurally distinct tracks. The distinction matters because the two tracks have different leading indicators, different supply chain dynamics, and different sensitivities to the capex and power growth data that investors already watch closely.
Track A — Scales with Power and Compute
These metals are embedded within the IT hardware itself: servers, GPUs, ASICs, networking equipment, and the power delivery and cooling infrastructure that supports them. Demand grows broadly in line with total installed compute capacity, measured in watts, and is therefore most sensitive to the TWh demand trajectory itself. Copper interconnect, lithium, tin, tantalum, silver, rare earth magnet metals, gallium, gold, and palladium all sit on this track.
Track B — Scales with Premises and Buildings
These metals are consumed during construction and power infrastructure installation. Demand is driven by new capacity additions — megawatts commissioned — rather than by total operating load. The relevant leading indicator is the premises-capex component of hyperscaler spending and the pipeline of new builds under construction, not the utilisation of capacity already energised. Steel, aluminium, and the large majority of new marginal copper demand sit on this track.
The two tracks diverge visibly once they are modelled separately. Because Track A scales linearly with total compute load while Track B scales with the increment of new capacity added, the two curves separate further apart the more aggressive the demand scenario becomes — which is precisely the environment in which getting the distinction right matters most.
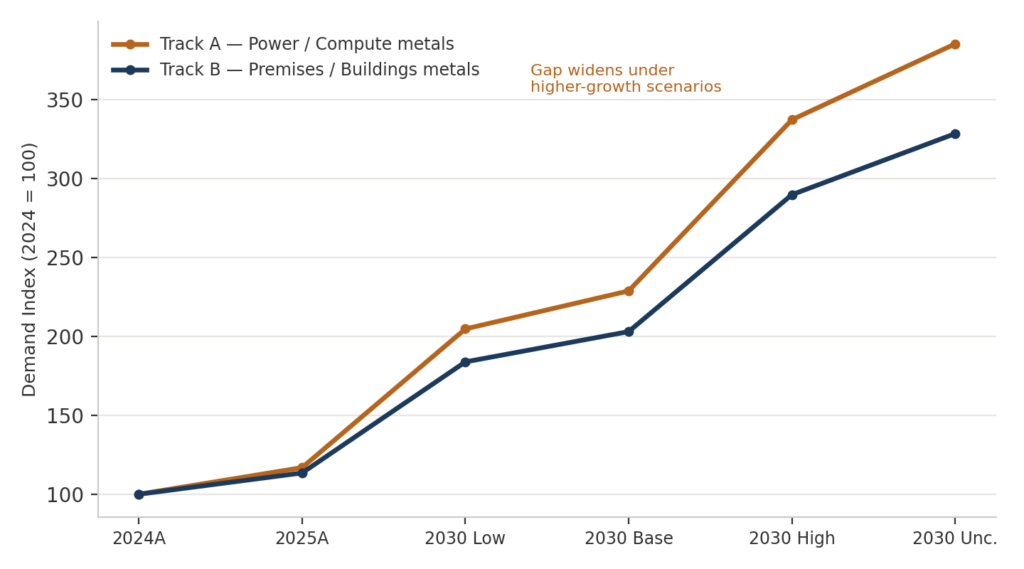
Copper is the single exception that proves the rule: it is the only metal that sits meaningfully inside both tracks at once — a small, high-value fraction embedded in chip-level interconnect and rack wiring (Track A), and a much larger volume consumed in building wiring, high-voltage transformers, and grid reinforcement (Track B). That dual exposure is why copper functions as the most acute cross-track risk in this analysis, and why datacenter developers, who treat copper as a rounding error at less than 0.5% of project cost, are structurally indifferent to a price signal that the rest of the market cannot ignore.
Section II. The Scale of the Underlying Surge
The two-track framework only matters if the underlying demand surge is real, sustained, and larger than previously modelled. On all three counts, the data confirmed since our early-2026 report point in the same direction: up.
Power Demand — Revised Upward
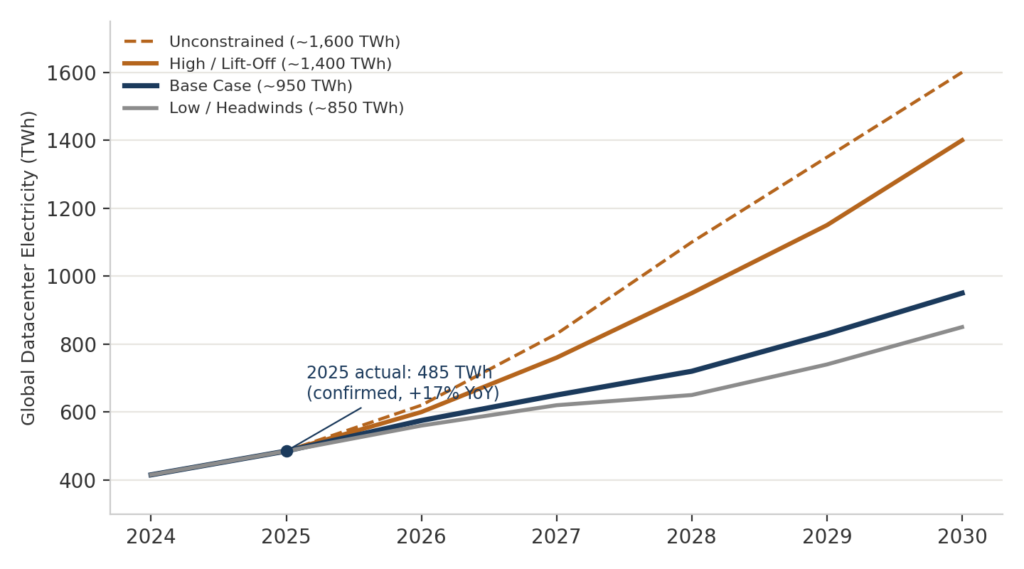
Global datacenter electricity consumption reached 485 TWh in 2025, a confirmed increase of 17% year-on-year (IEA, April 2026), with AI-focused datacenters growing capacity 50% over the same period. That actual print makes a 2030 floor below 850 TWh implausible absent simultaneous efficiency breakthroughs and sustained economic headwinds. Our base case for 2030 has been raised to approximately 950 TWh, a roughly 2.3x increase on 2024 actuals, with a scenario range extending from 850 TWh under sustained headwinds to 1,600 TWh under an unconstrained build-out.
Hyperscaler Capital Expenditure — The Corroborating Signal
The capex data corroborates the power data. The Big-4 hyperscalers — Amazon, Google, Meta, and Microsoft — combined for approximately $410 billion of FY2025 capital expenditure, a record. Guided 2026 capex following Q1 2026 earnings rises to approximately $725 billion, up 77% year-on-year. Not all of that increase is new physical capacity: an estimated $25 billion of Microsoft’s 2026 budget reflects component price inflation in high-bandwidth memory rather than incremental build. The five-company quarterly run-rate, including Oracle, reached $141 billion in the fourth quarter of 2025 alone.
| Scenario | Key Driver | 2025A (TWh) | 2028E (TWh) | 2030E (TWh) |
|---|---|---|---|---|
| Low / Headwinds | Efficiency gains offset growth; grid and chip bottlenecks persist; planning delays sustained | 485 | 650 | ~850 |
| Base Case | ~15% CAGR; bottlenecks partially resolved; aligns with IEA April 2026 central projection | 485 | 720 | ~950 |
| High / Lift-Off | $725B capex largely converts; AI agents scale energy use; grids unlock faster; Stargate delivers | 485 | 950 | ~1,400 |
| Unconstrained | All capex executes plus Stargate plus sovereign datacenter build-out; grid reform accelerates globally | 485 | 1,100 | ~1,600 |
Table 1 — Updated power demand scenarios. The prior low/high range of 700–1,225 TWh has been superseded; the new four-scenario probability-weighted expected value is approximately 1,103 TWh, versus 990 TWh under the prior framework.
Section III. Track A in Detail: What Scales with Compute
Track A metals are consumed inside the server, not the building. Their demand trajectory is therefore a direct read-through of installed compute capacity, and their leading indicator is the TWh scenario itself rather than the construction pipeline.
| Metal | Primary Application | Supply Risk | 2030 Signal |
|---|---|---|---|
| Copper | Chip-level power interconnect, GPU board traces, rack-level power cabling — scales with server count and compute density | Competes with Track B for the same refined supply pool; developers indifferent to price at <0.5% of project cost, amplifying volatility | Strong |
| Lithium | UPS battery banks (LFP-dominant) and on-site battery storage for grid stability — scales with compute power draw | EV demand competes for LFP supply; battery storage adds demand beyond backup power alone | Strong |
| Tin | Lead-free PCB solder for GPU boards and AI server motherboards — intensity rises with GPU proliferation | Myanmar export disruption; DRC Bisie mine (6% of global supply) politically exposed; ITA forecasts 40% demand growth by 2030 | Strong |
| Silver | MLCCs, conductive PCB inks, and thermal interface materials in high-density GPU racks | Fourth consecutive year of structural deficit; dual demand from AI and solar | Strong |
| Tantalum | Electrolytic capacitors in AI server power regulation circuits — count scales with server units and GPU density | Oligopolistic supply; ore price up more than 100% since 2024 | Strong |
| Rare Earths (NdPr) | Permanent magnets in cooling-system motors and fan assemblies — scales with compute density | China dominates; parallel EV and wind turbine demand competes for the same supply | Geopolitical |
| Gallium | GaN AI accelerator chips and optical transceivers — scales with GPU chip count | Chinese export restrictions since 2023–24; no resolution in sight; ~25% of global supply consumed by datacenters | Geopolitical |
| Palladium / Gold | MLCCs and bonding wire in high-reliability chip packages; palladium-coated copper substitution is the key thrifting lever | Automotive recovery competes for palladium; active thrifting under way in server-grade components | Moderate |
Table 2 — Track A metals, primary applications, and supply risk.
Section IV. Track B in Detail: What Scales with Premises
Track B metals are consumed once, at the point of construction, and their demand trajectory follows the pipeline of new capacity under development — not the utilisation of capacity already in service. Our projection model applies an 80% sensitivity of Track B volume growth to the incremental TWh added above the 2024 baseline, a conservative assumption; if AI-factory-grade construction, which uses more copper and steel per megawatt than legacy facilities, continues to dominate the pipeline, Track B demand could outperform the estimates in this report.
| Metal | Primary Application | Supply Risk | 2030 Signal |
|---|---|---|---|
| Copper | Building wiring, high-voltage transformers, external busbars, switchgear, cooling and earthing systems | Wood Mackenzie projects grid datacenter copper demand reaching 1.1 Mtpa by 2030; developers price-indifferent, amplifying demand surges | Critical |
| Steel | Structural frames for hyperscale campus buildings — up to 20,000 tonnes per large site | Supply adequate globally; specialist fabrication and logistics lead times constrained in peak build cycles | Strong |
| Aluminium | Server rack frames, cladding panels, cooling fin arrays, external busbar fabrication | US Section 232 tariff volatility adds cost pressure; energy-intensive smelting faces carbon cost pressure | Strong |
Table 3 — Track B metals, primary applications, and supply risk.
Copper: The Bottleneck Common to Both Tracks
Wood Mackenzie’s Horizons report, ‘High-wire act: Is soaring copper demand an obstacle to future growth?’ (October 2025), identifies datacenters as the most unpredictable demand variable in copper forecasting, projecting that AI-driven growth alone will lift grid-infrastructure copper demand to 1.1 million tonnes per year by 2030. Because that volume sits squarely within the Track B premises estimate above, our central copper estimates may prove conservative. S&P Global forecasts a material copper concentrate supply deficit for 2026 into an environment where datacenter demand is expected to rise a further 15.9% over five years, and Wood Mackenzie estimates that 7.8 million tonnes of new copper supply will be required by 2035 at a capital cost exceeding $210 billion. A single 100 MW AI campus, at 27–33 tonnes of copper installed per megawatt, absorbs up to 3,300 tonnes before upstream grid reinforcement is even counted.
Section V. The Combined Picture: Metals Demand by Scenario, 2024–2030
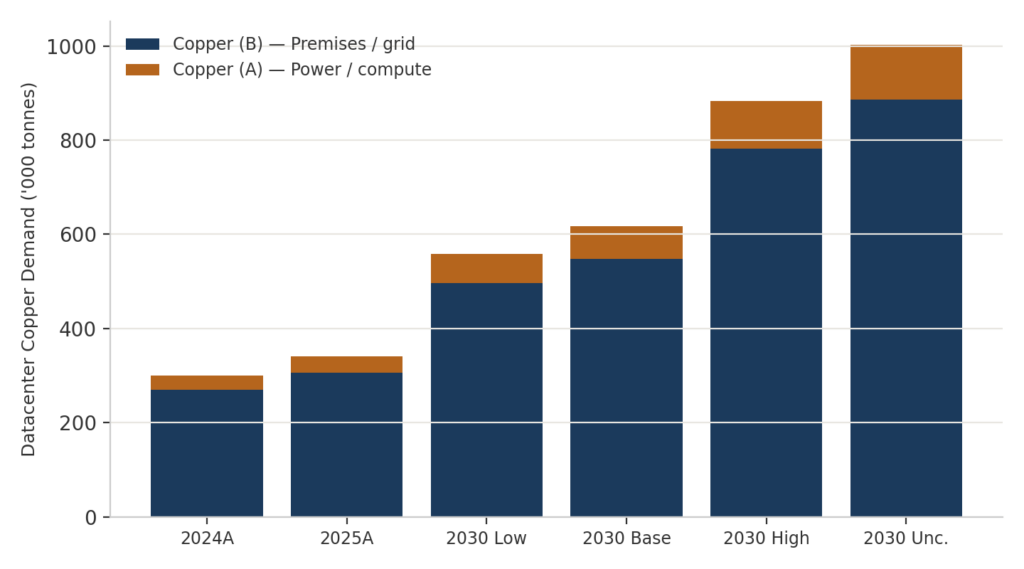
The table below consolidates the full metals demand picture across both tracks and all four scenarios, incorporating the 2024 baseline validation and confirmed 2025 actuals. Track A volumes scale linearly with the TWh trajectory; Track B volumes apply the 80% sensitivity factor described in Section IV to the incremental TWh added above 2024. All volumes are datacenter demand-attributable only; the forecasts exclude broader industrial and manufacturing demand for the same metal.
| Metal | Track | 2024A (t) | 2025A (t) | 2030 Low | 2030 Base | 2030 High | 2030 Unc. |
|---|---|---|---|---|---|---|---|
| Gold | A — Power | 12 | 14 | 25 | 27 | 40 | 46 |
| Palladium | A — Power | 18 | 21 | 37 | 41 | 61 | 69 |
| Gallium | A — Power | 35 | 41 | 72 | 80 | 118 | 135 |
| Rare Earths (NdPr) | A — Power | 160 | 187 | 328 | 366 | 540 | 617 |
| Tantalum | A — Power | 170 | 199 | 348 | 389 | 573 | 655 |
| Silver | A — Power | 250 | 292 | 512 | 572 | 843 | 964 |
| Tin | A — Power | 5,000 | 5,843 | 10,241 | 11,446 | 16,867 | 19,277 |
| Lithium | A — Power | 14,500 | 16,946 | 29,699 | 33,193 | 48,916 | 55,904 |
| Copper | A — Power | 30,000 | 35,060 | 61,446 | 68,675 | 101,205 | 115,663 |
| Copper | B — Premises | 270,000 | 306,434 | 496,410 | 548,458 | 782,675 | 886,771 |
| Aluminium | B — Premises | 600,000 | 680,964 | 1,103,133 | 1,218,795 | 1,739,277 | 1,970,602 |
| Steel | B — Premises | 2,400,000 | 2,723,855 | 4,412,530 | 4,875,181 | 6,957,108 | 7,882,410 |
Table 4 — Consolidated datacenter metals demand, 2024–2030, by track and scenario. Figures rounded; datacenter-attributable only.
Amongst the annual datacenter forecast demand levels listed above, where are the hot spots? Having mentioned copper already: 620kt (Track A + B) of new annual datacenter demand (2030 base case) is greater than 2% of all refined copper metal produced in 2025 (28.5 Mt). In a world where only one mine (Escondida) produced more than 600kt of copper in 2025, and a new mine producing more than 50kt of copper annually is considered a large mine opening, hitting the copper demand profile from datacenters is going to be very challenging from a supply-side standpoint.
The other material hot spot is tantalum, measuring 390t (2030 base case). For reference, the global refined tantalum market is only 2,400t today (2025 actual). While meeting datacenter forecast growth will be challenging, further tantalum supply will arise from hard-rock lithium bi-product supply tailwinds, largely from the lithium-ion battery sector (EVs and stationary storage) growth. That said, any physical market will struggle to grow 16% above current production levels in only 5 years.
Section VI. Why the Pipeline May Not Deliver on Schedule
Headline hyperscaler capex commitments do not translate directly into delivered physical metal demand on the ground. A meaningful share of the announced pipeline is facing delay or cancellation, driven by structural infrastructure constraints rather than demand weakness — a timing risk to both tracks, not a reduction in the underlying 2030 picture.
Of the 110 datacenter projects scheduled to come online in 2025, more than 25% were delayed by power access, permitting, and construction constraints. Industry analysis suggests 30–50% of capacity planned for 2026 delivery could face delay or cancellation. Project cancellations rose from six in 2024 to twenty-five in 2025, and the second quarter of 2025 alone saw twenty projects representing $100 billion in investment derailed or delayed — exceeding any prior episode since 2023. An estimated $64 billion of US projects have been cancelled or delayed since 2023.
| Bottleneck | Detail | Severity | Metals Impact |
|---|---|---|---|
| Grid connection lead times | Interconnection can take 5–7 years in the US in constrained regions; applications have surged | Critical | Delays Track B demand; copper grid reinforcement deferred |
| High-voltage transformer supply | Lead times stretched to 2–4 years for large units; hyperscalers outbidding grid suppliers | Critical | Copper and silicon steel demand concentrated in fewer projects |
| HBM memory shortage | Sold out through 2026; ~$25B of 2026 capex reflects price inflation, not added volume | High | Reduces effective compute capacity vs. capex headline; slows Track A growth near-term |
| Permitting and community opposition | 140+ activist groups across 24 US states; some state moratoriums under consideration | High | Delays both tracks in the most affected metro markets |
| Gallium/Germanium export controls | Chinese restrictions unresolved; supply limited for GaN chips and transceivers | High | Direct risk to Track A gallium demand; could constrain AI-factory density |
| Skilled labour shortage | Specialised electrical and cooling trades insufficient; equipment lead times 8–24 months | Moderate | Slows construction pace; Track B demand deferred, not cancelled |
Table 5 — Root causes of project delay and their differential impact on Track A versus Track B metals demand.
In April 2026, the US administration invoked Section 303 of the Defense Production Act to designate large-scale grid infrastructure as essential to national defense, authorizing emergency federal financing for key supply chain components — a policy signal that partially offsets the probability weight on the headwinds scenario. The key analytical implication holds regardless: delays compress near-term demand but do not reduce the cumulative 2030 endpoint. Deferred projects still build; they simply build later. For metals with long supply-development lead times — copper, silicon, silver, tin and tantalum ores — the underlying deficit persists even where datacenter demand temporarily moderates.
Section VII. Risk Register and Analyst Watch-List
Upside Risks to Demand
- AI agent proliferation drives energy-intensive, continuous inference workloads, materially exceeding current consumption models.
- Sovereign AI datacenter build-outs across the EU, Gulf states, Japan, and India add incremental demand outside the hyperscaler capex figures already modelled.
- Acceleration of the Stargate program — OpenAI has committed 7 GW across five US sites — would elevate scenarios if early capacity is delivered.
- Liquid cooling adoption could push copper content per megawatt above the 27–33 tonne assumption used in this report.
Downside Risks to Demand
- AI efficiency gains — a reversal of the Jevons paradox dynamic — could see per-task energy consumption decline faster than the IEA’s already ‘unprecedented’ projected improvement rate.
- Efficient model architectures demonstrate that capable AI may require materially less compute than frontier models assume, flattening the demand curve.
- Grid bottlenecks persisting beyond 2028 would defer both power-track and premises-track metals demand simultaneously.
- An economic downturn could reduce enterprise AI capex and cloud demand, particularly if AI revenue monetisation continues to lag infrastructure investment.
Supply-Side Watch-List
- Copper: monitor inventories, project development pipelines and FIDs, to gauge supply-side sufficiency to meet new datacenter and global growth demand.
- Lithium: global LCE demand is forecast to reach 1.8 Mt in 2025 and 3.7 Mt by 2030; datacenter share remains small but is the fastest-growing industrial segment in stationary storage.
- Tin: Myanmar export quota execution and security conditions at the DRC’s Bisie mine remain the key swing factors.
- Tantalum: monitor pricing rounds from Yageo/KEMET; Australian hard-rock tantalite and Rwandan concentrate upgrading are the medium-term supply response.
- NdPr / Gallium / Germanium: any resolution or escalation of the Chinese export control regime is the primary near-term price driver.
Section VIII. Conclusion: The Investment Implication of Two Tracks
A single TWh number invites a single trade. The two-track framework does not. Track A is, in effect, a leveraged play on installed compute: it moves with GPU shipments, server unit counts, and the pace of chip deployment, and its risks are concentrated in geopolitically exposed, thinly traded materials — gallium, rare earths, tantalum — where a small absolute tonnage shift can move price sharply. Track B is, in effect, a leveraged play on the construction and grid-connection cycle: it moves with permitting timelines, transformer lead times, and utility interconnection queues, and its risks are concentrated in bulk materials — copper, steel, aluminium — where the constraint is less about scarcity of the resource than about the physical pace at which supply, logistics, and construction labour can be mobilized, versus large supply-side markets with reasonable inventories and recycling pools to draw on.
These are different investment cases, with different catalysts, different diligence questions, and different failure modes. An investor underwriting exposure to Track A should be tracking hyperscaler power consumption, chip/rack performance, HBM allocation, and export-control developments in Beijing. An investor underwriting exposure to Track B should be tracking grid interconnection queues, transformer order books, and permitting litigation in the jurisdictions where capacity is being sited. Conflating the two produces a forecast, and a portfolio, calibrated to the wrong variable.
Copper is the connecting thread and the clearest signal in the entire analysis. It is the one material for which both tracks are pulling in the same direction at once, which is why it registers as the most acute bottleneck in this report even before broader electrification and grid-expansion demand — covered in our companion paper, The Paradox of Visibility — is added on top. Investors positioning for the AI buildout would do well to ask, of any metal or any mining asset, a simple question this framework makes explicit: which track is this exposure actually on, and does the underlying data support the track it is being sold as?
Appendix: Methodology and Data Sources
Power Demand Projections
- IEA, Key Questions on Energy and AI (April 2026) — base case 950 TWh by 2030; confirmed 485 TWh in 2025.
- S&P Global / 451 Research, global datacenter power demand analysis (November 2025, updated 2026).
- Gartner, Forecast Analysis: Data Center Power Consumption (November 2025) — 980 TWh by 2030.
- US Department of Energy, Datacenter Electricity Demand Report (December 2024); IEA Electricity Mid-Year Update (2025).
Hyperscaler Capital Expenditure
- Company 10-Q/10-K filings and earnings call transcripts: Microsoft, Alphabet, Amazon, and Meta (FY2025 and Q1 FY2026).
- Epoch AI combined capex database (Q1 2022–Q4 2025); Financial Times Q1 2026 hyperscaler capex compilation.
Metals Demand Data
- World Economic Forum, Securing Data Centre Materials Backbone (December 2025).
- S&P Global Commodity Insights, copper demand and supply analysis (2024–2026).
- Wood Mackenzie, ‘High-wire act: Is soaring copper demand an obstacle to future growth?’, Horizons Report (October 2025).
- International Tin Association annual user survey; USGS Minerals Commodity Summaries (Tantalum, 2025 edition); IMARC Group Tantalum Market Report (2026 edition).
- Precedence Research, Data Center Lithium-Ion Battery Market Report (2025); Passive-Components.eu tantalum capacitor demand analysis (March 2026).
Project Delay Risk
- Bessemer Venture Partners, AI Data Center Stack Roadmap (May 2026); Sightline Climate, Data Center Outlook (February 2026).
- Bain & Company, 2030 Global Data Center Forecast (October 2025); Construction Dive, Data Center Project Cancellations (April 2026).
- MMCG, US Hyperscale Data Center Development Challenges (October 2025); S&P Global Energy, Data Center Opposition and Power Demand (January 2026).

Important Information
This material is provided for educational and informational purposes and should not be construed as investment research. The information presented is not a complete analysis of the datacenter, semiconductor, or critical minerals landscape. None of the information constitutes a recommendation by RCF, or an offer to sell, or a solicitation of any offer to buy or sell any securities, product, or service, and is not intended to provide investment advice.
This document is not intended to constitute legal, tax, or accounting advice or an investment recommendation. Individuals should seek advice from their own legal, tax, or investment counsel; the merits and suitability of any investment should be assessed independently. This document includes forward-looking statements and scenario analysis, and we caution that such information is inherently less reliable than historical data. Scenarios are based on estimates and assumptions about events and conditions that have not yet occurred, any of which may prove incorrect, and actual outcomes may differ materially. RCF undertakes no obligation to update or revise any forward-looking statement or scenario, whether as a result of new information, future events, or otherwise.
Commodity- and metal-specific figures in this report are estimates derived from publicly available data, third-party research, and analyst modelling, and are provided as illustrative examples only; each commodity is subject to its own facts and circumstances, and this information should not be treated as a recommendation of any specific commodity, company, or security. The 2030 unconstrained scenario is presented as an analytical ceiling, not a central forecast.
The opinions expressed may change as subsequent conditions vary. Information and opinions in this material are derived from proprietary and non-proprietary sources deemed by RCF to be reliable; no representation is made that this information is accurate or complete, and there is no guarantee that any forecast will come to pass. Reliance on information in this material is at the sole discretion of the reader.
Past performance is not indicative of future results. Investing involves risk, including possible loss of principal.